Valuable analysis basis at the point of interest

Geofencing for targeted new customer acquisition

Trade fairs are finally taking place again and are therefore well attended. Thus, with “Fleet!” Germany’s largest fleet trade fair and THE meeting place for the fleet industry opened its doors in March once again. One of the exhibitors was a large automotive company that asked itself the following questions, among others: “How do my stand visitors actually describe themselves and are they different from other trade show visitors? How can I address my visitors digitally in compliance with data protection regulations? How can I find and advertise to similar target groups?” The car manufacturer turns to Schober with these questions and commissions a so-called geofencing project.   We would now like to tell youwhat geofencing actually is, how it works and what added value it offers advertisers.

Geoanalysen
Geofencing

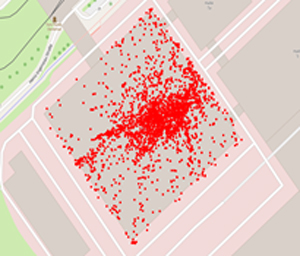
Movement points in polygon

What is geofencing?

Geofencing is a technology that makes it possible to trigger certain actions or events when a mobile device or a GPS-enabled device enters or leaves a predefined geographical zone or fence (“geofence”). This can be used to send notifications, collect data or perform other actions as required. Of course, tracking is carried out on an anonymized data basis and in strict compliance with data protection regulations via mobile devices that cross the geofence boundary.

So how exactly does this work?

The process uses smartphones on which users have granted location access to certain apps as a database. The device then sends geo-coordinates with a timestamp to the app publisher at specific intervals. Schober then uses the non-personal data and continues to match it at the cell level against the Schober data universe in a manner that complies with data protection regulations. On this basis, some descriptive features can be temporarily enriched for qualification purposes. For the concrete geofencing analysis, the Schober analysis team first needs content input on the event: date, time, location, areas, booths at the trade fair. The defined areas are then geocoded using the input supplied in the form of hall plans, maps and drawings, and the desired locations and times are delimited using geographically accurate polygons.

How does geofencing benefit our automotive company?

Geofencing

Massive increase test drives

Our automobile manufacturer uses the Schober geofencing methods described above to gain deeper insights into its trade fair visitors – and this goes far beyond the purely quantitative recording of event visitors. This is because the added value clearly lies in the data protection-compliant utilization of these findings for marketing purposes. Schober Senior Consultant and Geostrategist Sven Waldenmaier explains: “By temporarily enriching valuable additional information from our unique data universe, event visitors can be delimited as target groups at the cell level and described in more detail. Our customers can first address event visitors digitally in a targeted manner, for example for an event follow-up. In addition, the target group descriptions can be used to form so-called look-alikes (i.e. similar target groups or potential new customers) in the Schober data universe in compliance with data protection regulations, which can then be addressed online and offline as part of accurate marketing campaigns via various channels.” And that doesn’t just apply to trade fairs and events! Geofencing can be applied to any point of interest (POI). “We also collected information on car dealership visitors. This means that current visitors from one or more car dealerships – our own or those of our competitors – were recorded, analyzed and targeted with qualified marketing messages. In one specific case, this approach has already more than doubled the number of test drives,” continues Sven Waldenmaier.

General usage possibilities of geofencing

So we can conclude: Using geofencing, it is possible to quantify the anonymous visitors to a POI, qualify visitor groups and subsequently address them in a targeted manner in order to gain high-quality new leads. Thanks to the unique combination of mobile movement data with valuable additional information, geofencing enables companies in all sectors to generate new added value for their marketing.

Geofencing

Movement

frequencies Here are a few more examples of the numerous possible applications of geofencing analyses:

  • Location planning: Where do high-affinity target customers live? Where is a branch worthwhile, where not?
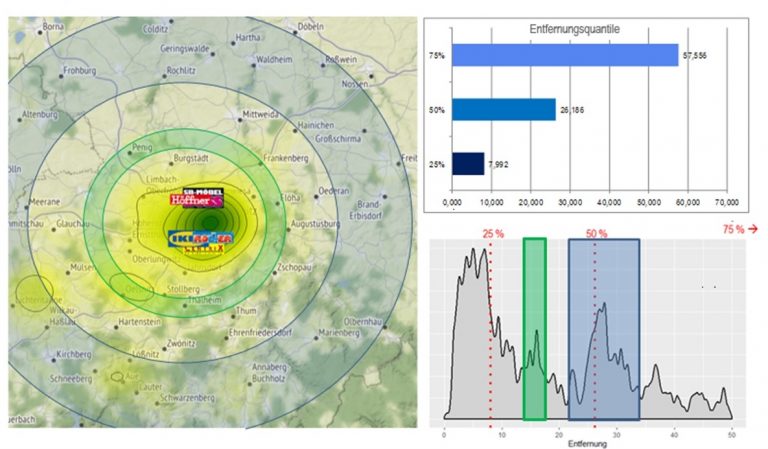
  • Catchment area analyses: Where do my store visitors live and how can they be described?
  • Advertising effectiveness checks: Who reads my advertising digitally and comes to the store, who reads print advertising and orders online? Can this be used to optimize distribution areas or distribute digital advertising in a more targeted manner?
  • New customer acquisition: Which channels can I use to get similar target groups excited about my products?
  • Competitor monitoring: Which customers also go to the competition? How are they different from loyal customers? Which customers seem at risk of churn?

These and many other questions can be answered comprehensively with geofencing technology in combination with Schober’s data universe and analysis know-how. Incidentally, geofencing also plays an important role in fleet management with the aim of more efficient fleet management. If a vehicle crosses or leaves defined geographical fences, the geofencing system registers this and triggers a notification or alarm. In practice, this is successfully used, for example, to locate vehicles, prevent theft, reduce costs through route tracking or increase fleet productivity. Which brings us back to the starting point of “Fleet! The industry get-together! The next two-day fair is not far away. Just like the other motor shows that are still to come, from Retro Classics to the IAA. Just do it like our car manufacturer, find out more about your visitors and address them specifically. Sven Waldenmaier

  Our geomarketing expert Sven Waldenmaier looks forward to entering into dialog with you and providing you with comprehensive advice. Feel free to contact him directly HERE. Your Schober Team

Contact

You would like to know more? We are looking forward to your inquiry.

Simply fill out the form with your data and your request. We will get back to you as soon as possible. Alternatively, you can also make an appointment directly via Calendly.

Make Calendly appointment directly
salutation
* mandatory fields
* mandatory fields
Thank you very much! Just one more step … In order for us to process your request as quickly as possible, please confirm your request in your email inbox now. If necessary, please also check the spam folder.
ALWAYS UP TO DATE

Subscribe to our newsletter.

Discover a world full of knowledge and opportunities! To take your business to a new level, you will receive in our newsletter

  • up-to-the-minute insights
  • groundbreaking trends
  • exclusive content and
  • access to valuable discount promotions

  Register now and experience how data and digitalization go hand in hand for your success.

The prospectus is dead, long live the prospectus

Measure campaigns and advertising success with geofencing

“What is our return on marketing investment?”

“Do digital or analog forms of advertising provide the higher revenue boost?”

All marketers know these important questions. But answers are hard to come by: many factors interact and there is usually a lack of data for a reliable analysis. This applies, for example, to the classic in the retail trade: the brochure. But there is a way to get to the bottom of the success factors. We took a look at digital and printed brochures in comparison. The result is already surprising, but even more exciting is the method.


How did we proceed?

Geodata makes customer paths visible

Digital marketing usually also generates data for campaign evaluation at the same time. This is different for offline measures. The brochure of, say, a nationwide retail chain in the mailbox does not send a response as soon as it is read. Nevertheless, it is possible to determine the advertising impact of the brochure – using Schober Geofencing.

This method uses smartphones as a database, on which users allow certain apps to access their location. The Device then sends motion points with timestamps to the App Publisher. Schober buys this data (the database currently contains over 52 million unique mobile IDs) and matches it against the Schober data universe in accordance with data protection regulations. Now, based on these IDs, we can narrow down to the desired locations and times using geographically accurate polygons.

Revolutionary use cases of Schober Geofencing

catchment area

Catchment area

In this way, the initially “data-less” offline measures can be provided with data for measuring the efficiency of these measures. What you couldn’t see before now becomes transparent. This results in revolutionary use cases:

  • Analysis of visitor profiles using third-party data plus a comprehensive analysis of catchment areas
  • Formation of realistic personas as a basis for qualified and individual target customer approach
  • Optimized targeting of store visitors (including competitors’ store visitors)
  • High-five analyses of the competition in time and space
  • And, of course, measuring campaigns and advertising success in terms of actual store visitors. After all, anyone who reads the printed brochure and feels addressed will also come to the store to make a purchase.

Classic brochure or not?

Store visitors

Store visitors

So much for the method, but what has the greater advertising impact? The analysis based on the matched data shows that there is no universal answer, because the result depends on socio-demographic structure, competitive environment, store locations and other aspects. From several projects, however, which we have carried out nationwide for different retailers and specialty chains
have performed, one can derive the following rules:

  • Digital brochures are effective and ensure a higher frequency of visits to the stores.
  • Printed brochures also have a good advertising impact, which is reflected in higher numbers of visitors to the stores.
  • Digital and printed brochures activate very different groups of buyers – as shown by various profile analyses at zip code level.
  • Digital brochures appeal to a younger and more open-minded target group, while printed brochures attract customers with significantly more purchasing power.
  • Measures that incorporate real-life shopping routes for store visitors work particularly well. In other words, anyone who visits a gym is also interested in sports equipment suppliers on their way to the gym.
  • The best advertising impact is achieved by cross-media campaigns that use radio or TV in addition to brochures.

The surprise? The brochure is and remains a strongly activating element in advertising. Digital advertising formats can complement very well, but they are unlikely to replace the brochure in the foreseeable future. What’s more, anyone looking for purchasing power is printing.

Sven Waldenmaier

Offline and online advertising measurement

Measuring campaign and advertising success has been a particular challenge for offline campaigns. But with Schober Geofencing and the right analysis steps, advertising measures in their entirety – online and offline – can be precisely recorded, evaluated and optimized for maximum sales boost.

What are your experiences? Have you faced similar challenges? Do you use geospatial data in your marketing?

Our geomarketing specialist Sven Waldenmaier is looking forward to learning more and entering into a dialog with you. Feel free to contact him directly HERE.

Contact

You would like to know more? We are looking forward to your inquiry.

Simply fill out the form with your data and your request. We will get back to you as soon as possible. Alternatively, you can also make an appointment directly via Calendly.

Make Calendly appointment directly
salutation
* mandatory fields
* mandatory fields
Thank you for your inquiry. We will get back to you as soon as possible.
ALWAYS UP TO DATE

Subscribe to our newsletter .

Discover a world full of knowledge and opportunities!
To take your business to a new level, our newsletter will give you

  • up-to-the-minute insights
  • groundbreaking trends
  • exclusive content and
  • access to valuable discount promotions


Register now and experience how data and digitalization go hand in hand for your success.

Sales can only bubble up where there are customers

With geo-analytics for customer loyalty

Hotspots for the new store concept: Where have customers migrated to and how do companies retain newly acquired customers?


by Sven Waldenmaier, Geo Specialist and Teamlead Sales at Schober

There is no doubt that the Corona pandemic had a strong impact on the store business and customer loyalty. For a long time, stores were closed altogether, so consumers sought alternative ways to shop. But which developments will remain, which will disappear? A large drugstore chain approached us with this question. The aim: to review the store network and realign it if necessary. Because sales can only bubble up where there are customers. So where are the customers?

Evaluate spaces qualitatively and quantitatively

The starting point of our analyses were two central questions. First, how can areas be quantitatively assessed using data to identify hotspots? Secondly, it was also about a qualitative classification of customers. After all, it is of little use if you operate a store at a frequented location but there is little demand for the drugstore’s offering there. A gas station in the pedestrian zone makes no sense, that is immediately clear. For less obvious cases, however, business decision-makers need more in-depth information – on the purchasing power of pedestrian flows, for example. This is because, in extreme cases, the costs for the store can be higher than the sales that can be generated. The Apple Group may take that on itself with its brand stores, because it’s all about awareness here. Our drugstore chain, however, pursues a different business model, with the store as the central distribution channel.

We therefore started with a nationwide analysis of pedestrian flows in around 200 areas with a high density of stores – i.e. pedestrian zones, city center locations and shopping centers. The Schober Information Group has more than 55 million “Unique Mobile IDs”. On the basis of these anonymized identifiers, which comply with data protection regulations, pedestrian flows in defined areas can be read and interpreted. The procedure in detail:

  • Step 1: Definition of grids (170m edge length) around the respective location of the existing stores.
  • Step 2: Specification of the pedestrian frequency per grid. How does this compare to the national average, and how does it compare to other downtown areas?
  • Step 3: How high is the proportion of people with an affinity for drugstores in the respective area compared to Germany as a whole?

Qualify, qualify, qualify

Step three is crucial for supplementing the initially purely quantitative view with qualitative characteristics and thus gaining truly sales-promoting insights. Based on affinities, pedestrian flows and store visitors can be more precisely qualified and conclusions drawn about interests. Anyone who goes to a gym three times a week has a higher affinity for sportswear and personal care (at least I hope so) than other passersby. On the other hand, people who stroll through the pedestrian zone of a large city every day (even on Sundays) are more likely to be looking for entertainment than specifically for purchases. Those who primarily frequent discount stores are more price sensitive than the subscriber to a high-end luxury spa downtown. Which competitors have visitors to my drugstore visited before and what do they buy then? Now, the data is collected anonymously, but crucial insights can be drawn from the aggregate.

Along the analog customer journey

Even more insights are gained by using third-party data – such as the Schober data universe – for the analysis. Our drugstore chain specifically used this sociodemographic data to additionally determine purchasing power, family structure, living conditions and many other attributes of the pedestrian flows in the store environment and the store visitors. In this way, it is possible to see how the residents of a villa suburb with high purchasing power prefer to store or where families from the “Speckgürtel” of Hamburg, Dresden or Cottbus go shopping. The examples show: Geomarketing makes the analog customer journey – places, routes, purchases – of customers transparent and thus controllable.

Profiling so that customers and suppliers benefit equally

After all, only those who know where their target customers spend their time, where they go shopping, and what other interests they have can create target group and visitor analyses with a high degree of precision. This is the prerequisite for profiling the target groups according to personas and, as a result, for a sales-boosting approach: at which location should billboards draw attention to the store offer, where should brochures be distributed, who should be lured into the outlet with offers? In addition, locations can be accurately assessed and hotspots identified. If you profile your target groups, you can respond more precisely to their demand and make offers where it is highly likely that sales can be turned around. And in the same way, these insights can also be used to make targeted online offers that supplement the branch network as the main sales channel at key points.

What remains, what disappears?

So back to the drugstore chain and the consequences of the pandemic: How badly has the store environment suffered? How much did the frequency of store visitors decline and how quickly did it recover after the lockdowns? What is the role of incidence values, location, environment? We had investigated this and, in the case of drugstores, found increasing store visits. Of course, because drugstores, as suppliers of daily necessities, remained open during the lockdown – in contrast to perfumeries and sports stores, which had to switch completely to online.

Geofencing procedure

Procedure geofencing analysis

The migration of customers away from specialist retailers is therefore actually an influx for drugstores – new customers were gained in the high-priced fragrance segment, among others, and sporting goods were also in high demand. Will new customers remain loyal to drugstores after the lockdown? The analyses from geomarketing show that a remarkable 17% of customers who frequented different chain stores before the lockdown remain exclusively with drugstores after the lockdown. The optimal response to this change depends on the perspective: Specialty retailers such as perfumeries and sporting goods stores attract – according to the analysis of passers-by and visitor flows – above all a clientele with purchasing power in the 40 to 59 age group, who also otherwise move around spas and beauty salons, exclusive fashion boutiques and delicatessens. To win back these customers, retailers would have to expand their stores in the identified hotspots. Drugstores, on the other hand, should supplement their traditional high-turnover locations in the vicinity of cinemas, fitness studios or stores for baby supplies with new locations in lifestyle hotspots with an extended product range. In addition to the choice of location, joint marketing activities with suitable corporate partners from the areas identified by geomarketing are also promising – cross-selling and co-marketing can sustainably bind the new customers.

The biggest competitor, however, remains purchasing on the Internet. That’s why all chain stores should follow three maxims: Invest in hotspots and the right assortment, complete your branch offering with a web store and, above all, think branch and online store together. After all, retailers only generate revenue if they are present in the exact place where their customers are.

Seven key questions: Is your branch network optimally aligned?

  1. Do you know who visits your stores and with what frequency?
  2. Can you identify hotspots nationwide?
  3. Where do customers migrate to, where do you gain customers from?
  4. Are you leveraging your cross-selling and upselling potential against neighboring businesses?
  5. Do you know the analog and digital customer journey of your target groups?
  6. Can you profile target groups for a sales-boosting approach?
  7. Do you think branch and online business integrated?


Sven Waldenmaier

Let’s talk about your individual challenges!

I look forward to learning more and engaging in dialogue with you.

Feel free to contact me directly HERE.

Your Sven Waldenmaier


This article appeared on 21.06.2021 in Marketingbörse magazine, among others.

Contact

You would like to know more? We are looking forward to your inquiry.

Simply fill out the form with your data and your request. We will get back to you as soon as possible. Alternatively, you can also make an appointment directly via Calendly.

Make Calendly appointment directly
salutation
* mandatory fields
* mandatory fields
Thank you for your inquiry. We will get back to you as soon as possible.
ALWAYS UP TO DATE

Subscribe to our newsletter .

Discover a world full of knowledge and opportunities!
To take your business to a new level, our newsletter will give you

  • up-to-the-minute insights
  • groundbreaking trends
  • exclusive content and
  • access to valuable discount promotions


Register now and experience how data and digitalization go hand in hand for your success.